
$25.00 $40.00 Sale
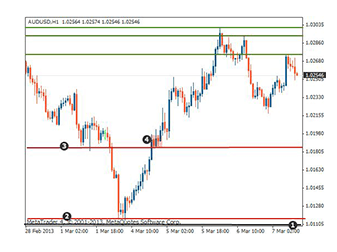
Open your chart and find the highest price level.
Now place a line on the chart and move it down the first resistance level that you find:
Place a second line on the chart and move it down, below the current line you already have on the chart, until you find the next resistance level as the following chart shows:
Continue to place resistance levels on your chart until you reach the current market price.
You do not want to put too many resistance levels on your chart – just the most important ones:
Place a line on the chart and move it up to the first support level that you find:
Place another line on the chart and move it up to the next support level:
Continue to place support levels until you reach the current market price. You do not want to place too many support levels on the chart, but rather try to pick the most significant support levels.
Once you have finished, you now have a price chart with a number of support and resistance levels that will look something similar to the chart above.
Now continue on to the next lesson to learn the first method of trading with support and resistance levels.
– After making a purchase, you will see a View your order link to the Downloads page. Here you can download all the files related to your order.
– In case the link is broken for any reason, please contact us and we will resend a new download link.
– If you can’t find the download link, please don’t worry about it. This course is usually available and shipped within one day
– The course you purchased will have lifetime access
– Our support staff is the best by far! Please contact us at email: [email protected] and we will be happy to help!